Indy Node Monitoring
Blockchain networks are spreading and Hyperledger Indy is one of the most used to provide a distributed ledger for decetralized identities, I’m working with several chains professionally, and I miss having some monitoring tools for them, so I decided to develop a monitoring PoC. I also took the opportunity to try github workflows, as I did with other CI/CD tools like Jenkins or BitBucket Pipelines.
Monitoring the blockchain
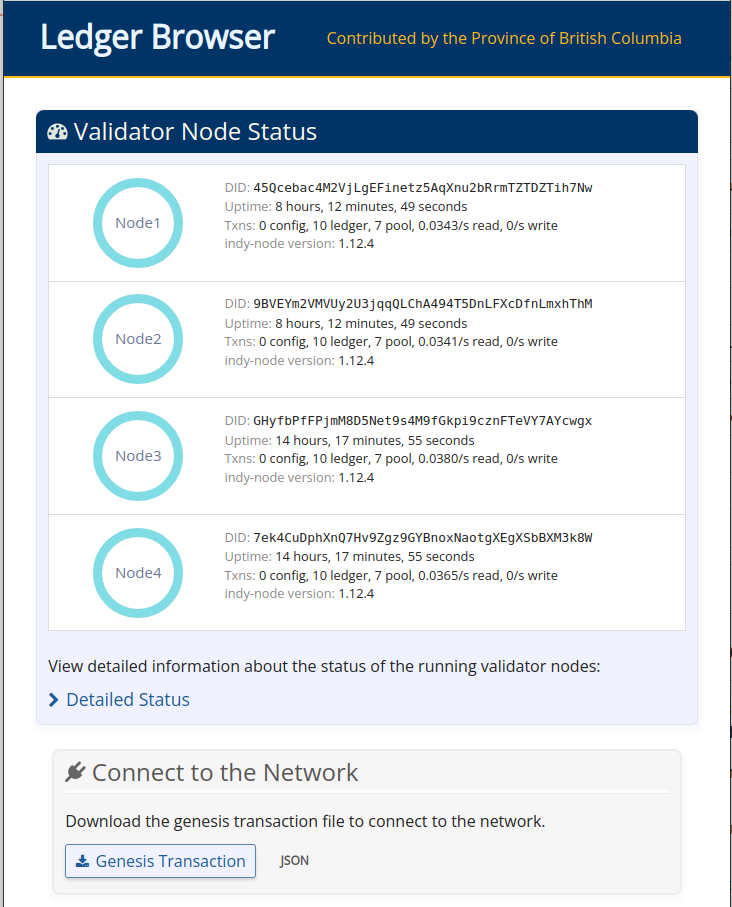
The British Columbia Government provided a basic but yet powerful indy ledger browser, it was aimed to allow developers be aware of what’s inside their chains, but it wasn’t suitable for big chains with hundreds of thousand of transactions, as it cached the transactions in a SQLite database, and, the worst part, rereads the entire chain every time it was started. If you need to browse your production chain, indyscan is a much better solution which uses elasticsearch as a local cache.
But it had a nice feature, a dashlet that showed the state of the nodes, a feature that indyscan lacked, so I decided to strip down the browser from any feature I didn’t need: caching, did registering and ledger browsing.
Once I got rid of them, I decided to implement a prometheus/OpenMetrics compatible metrics endpoint, to allow integration with any openmetrics compatible tool.
Generating the metrics endpoint
The first step was to create the /metrics route for the aiohttp server, I’m not a experienced python developer, but the file had plenty of examples, so I copied the removed /status/text definition block:
@ROUTES.get("/metrics")
async def metrics(request):
    status = TRUST_ANCHOR.public_config
    if status["ready"] and not status["anonymous"]:
        try:
            validator_info = await TRUST_ANCHOR.validator_info()
            metrics = generate_metrics(validator_info)
        except NotReadyException:
            return not_ready()
        except asyncio.CancelledError:
            raise
        except Exception:
            LOGGER.exception("Error retrieving metrics info")
            metrics = ""
            web.Response(status=503)
    return web.Response(text=metrics)
The generate_metrics function was defined in the metrics.py file generating a few metrics from all the availables as an example. Please check metrics.py on GitHub for reference.
The most important there was how to create the metrics, for instance:
for k,v in obj["Node_info"]["Metrics"]["transaction-count"].items():
    metrics.append("indynode_transactions{node=\"" + node + "\",ledger=\"" +  k +"\"} "+ str(v))
Generated the output:
indynode_transactions{node="node1",ledger="ledger"} 10
indynode_transactions{node="node1",ledger="pool"} 7
indynode_transactions{node="node1",ledger="config"} 0
indynode_transactions{node="node1",ledger="audit"} 16924
for each node.
Configuring prometheus
As I had previous experience with prometheus, it was pretty straightforward to deploy it using the oficial container images, using docker-compose made the things even easier, as I was able to use the browser container’s name on the scraper configuration:
scrape_configs:
  - job_name: "indynodes"
    static_configs:
      - targets: ["browser:8000"]
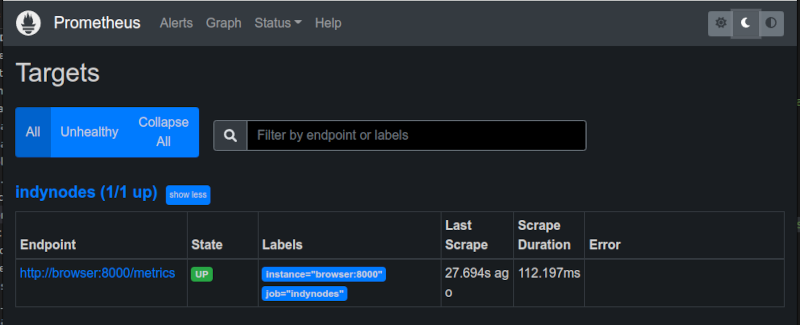
Visiting the targets section on th prometheus interface at http://localhost:9090 showed a couple of formatting errors at first, but I corrected them and then the target showed as healthy.
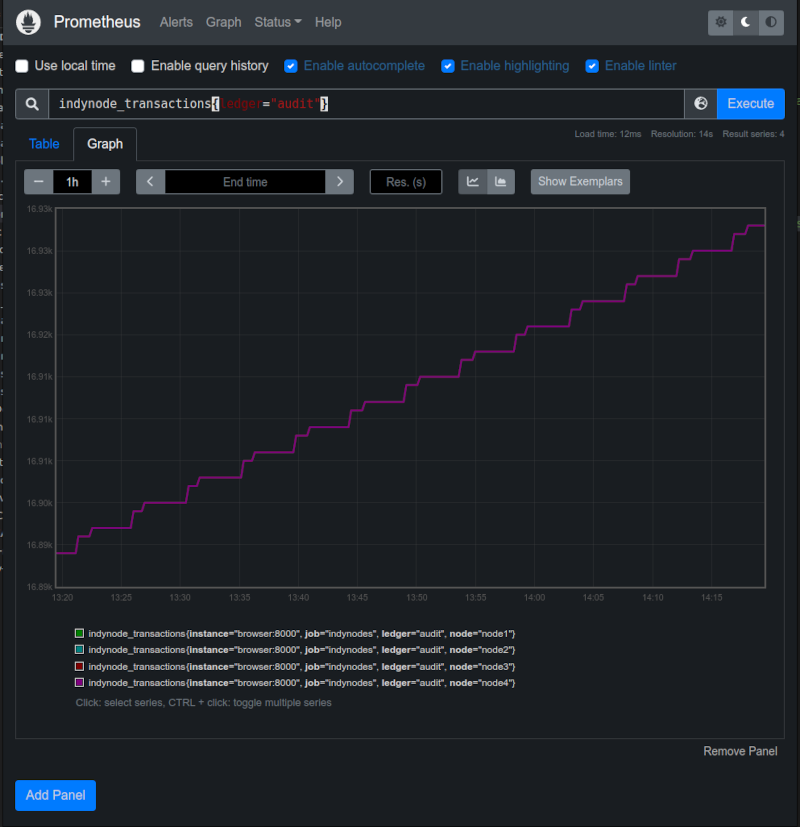
Some basic queries could be performed at prometheus interface.
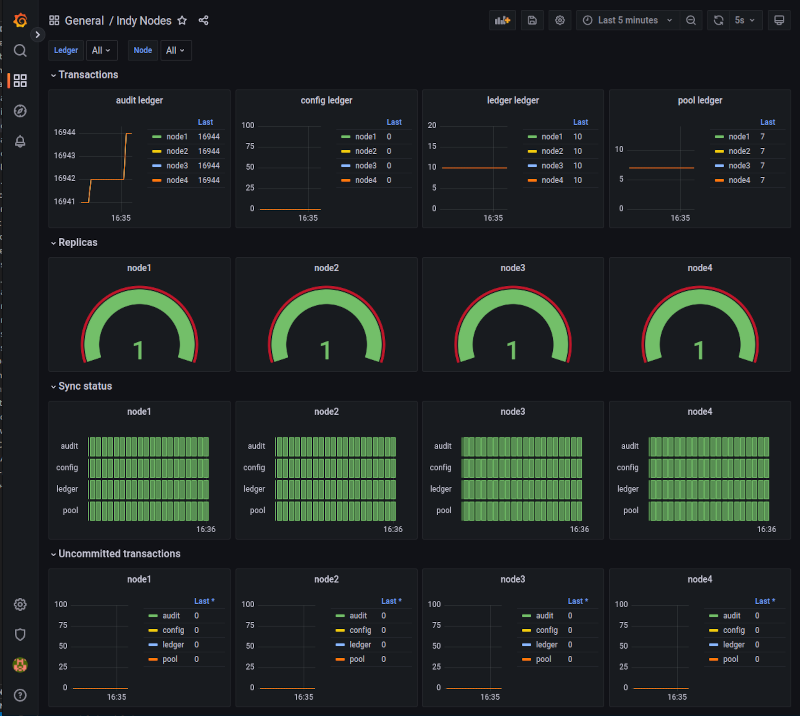
Configuring grafana
Prometheus was enough for doing basic queries, but for displaying dashboards or handle complex queries, grafana was much more powerful. As this was a traning environment, which was going to be erased and redeployed several times, I provisioned it using the configuration as code methodology.
For datasources, it was very simple: drop a yaml file inside /etc/grafana/provisioning/datasources with your definitions, mine was:
apiVersion: 1

datasources:
  - name: Prometheus
    type: prometheus
    uid: "mH0fjRW4z"
    isDefault: true
    url: http://prometheus:9090
    version: 1
    editable: true
Again, I used the container name to access it.
Provisioning the dashboards was a two step process, first create the dashboard provider file in /etc/grafana/provisioning/dashboars and then, put the dashboard definition file were you pointed at.
My dashboard provider file had the following content:
apiVersion: 1
providers:
  - name: indy
    allowUiUpdates: true
    options:
      path: /etc/grafana/provisioning/dashboards/indy
      forlderFromFilesStructure: true
The dashboard definition file was a big chunk of json I exported from the grafana interface, you can check it at the repo. The important part here is to match the datasource uid in both the datasource definition and the dashboard definition.
Creating the github workflows pipeline
I could have built the image manually and pushed it to the docker hub registry, but I’m a devops engineer, so I felt compelled to automate the building of the image.
As I uploaded the code to GitHub, I couldn’t set up a webhook pointing to my jenkins service at home, neither I wanted it, so I tried github workflows.
Enabling workflows was as easy as dropping a file, well, to be precise, it was automatically activated when I created the repository, and the file was to define the workflows. This file was located at .github/workflows and was a copy of the example from the github documentation.
The things I had to change were the branch, as I wanted to use the “main” branch, and the generated tags. I used the following in the meta step to generate a tag based on the build number, and to add the latest tag.
tags: |
    type=raw,value=latest,enable=${{ github.ref == format('refs/heads/{0}', 'main') }}
    type=raw,value=${{ github.run_number }},enable=${{ github.ref == format('refs/heads/{0}', 'main') }}
The conditional was unnecessary as I was working only on the default branch, but I kept it for reference.
After commiting the files and pushing my working copy to the repo, the workflow started automatically:
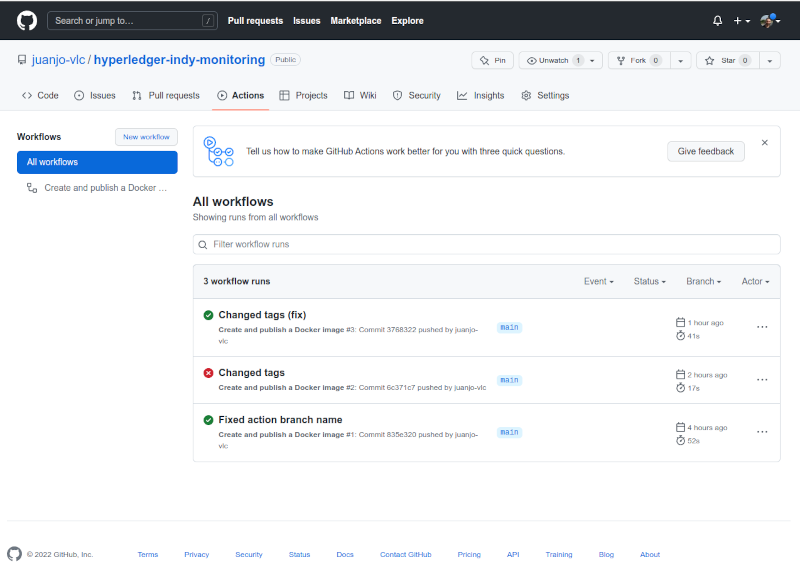
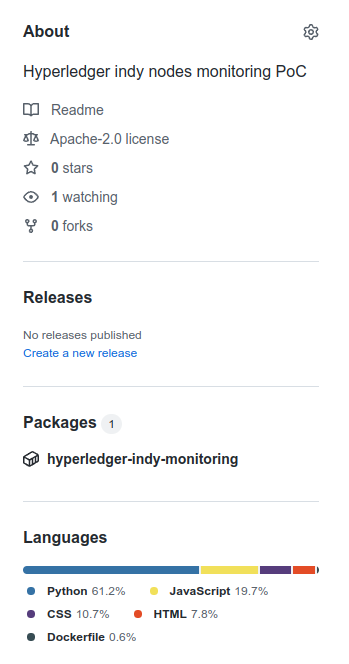
And when completed, the image was added to github packages and linked to my project.
Conclusions
Even though this was only a PoC about monitoring Hyperledger Indy networks, it helped me to know a bit more about what the “validators-info” command can show, and this is a starting point if I want to go deeper at any time.
It also gave me the opportunity to start using GitHub actions/workflows to build images, and that could help me to speed up some tasks on future exercises.
References
- https://docs.github.com/en/actions/publishing-packages/publishing-docker-images#publishing-images-to-github-packages GitHub documentation about building images on workflows.
- https://www.hyperledger.org/use/hyperledger-indy Hyper ledger indy project page
- https://github.com/bcgov/von-network British Columbia Goverment’s VON Network project