Monitoring Docker With Elastic Agent
In this post I’m covering how to set up a standalone elastic agent to monitor both the docker host, and the containers within. The info in elastic documentation is pretty comprehensive, with a lot of examples, but I had specific needs, and ended up doing a lot of cherry-picking. And, as always, the best way to understand something, is trying to explaining it.
Setting up the E_K stack
The first step was to set up the stack, no need for logstash at this point, so I didn’t deployed it, only Elasticsearch and Kibana.
The Install elasticsearch with Docker had everything I needed to deploy it, so not much to comment here, but I though TL;DR and skipped directly to their docker-compose example. Obviously it didn’t work, and I had to go through the logs searching for clues until I found:
bootstrap check failure [1] of [1]: max virtual memory areas vm.max_map_count [65530] is too low, increase to at least [262144]
The truth was, I was sure I’ve already set ```vm.max_map_count`` on the host, as I’ve used it several times for other es-related experiments, but I was completely wrong.
So I added the setting to a file under the systcl.d configuration dir and reapplied the configuration. This is my prefered way to do to ensure it will be set also on the following boots.
cat <<<EOF >>/etc/sysctl.d/98-juanjo.conf
vm.max_map_count=262144
EOF

sysctl --system
Then I restarted all the containers in the docker-compose.yml file, and all started working. Please note the first boot takes a bit longer as Kibana has to initialize its data structures on elastic.
Defining an agent policy on elastic
The next step was to define a elastic agent policy in elastic, for that, we first go to http://docker-host-ip-address:5601 and enter the elasticsearch credentials here, the user is elastic and the password is the one we set for the ELASTIC_PASSWORD variable in the .env file on the previous step.
Once logged in, we can go to the Fleet section on the left menu, then to the Agent policies tab, and create a new agent policy, as my objective was to monitor both the host and the docker stack, I defined a new policy called Docker Hosts.
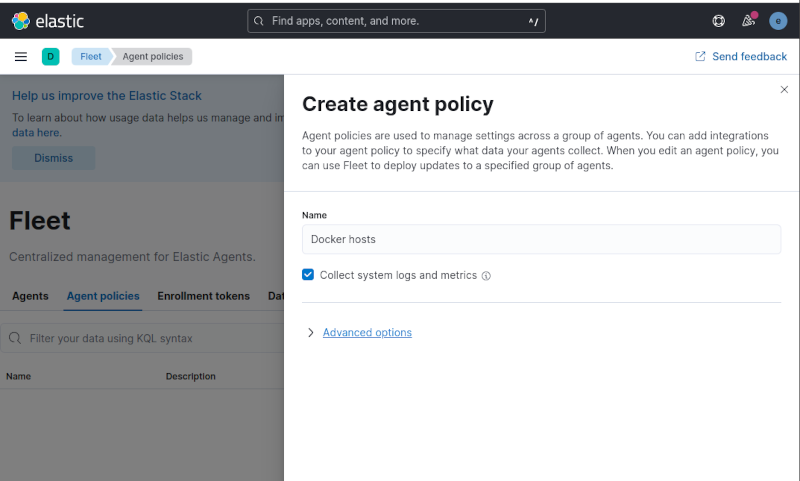
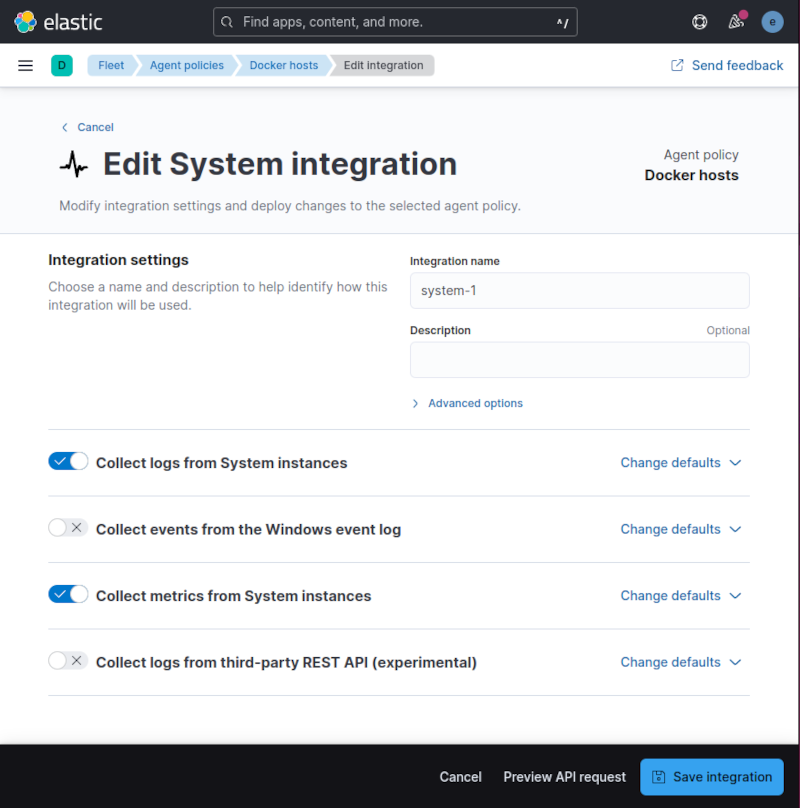
Beside the name, all settings were left at default values. Once created, a System integration was added automatically. As I didn’t want to monitor window hosts, I edited the policy and disabled the collection from Windows event log.
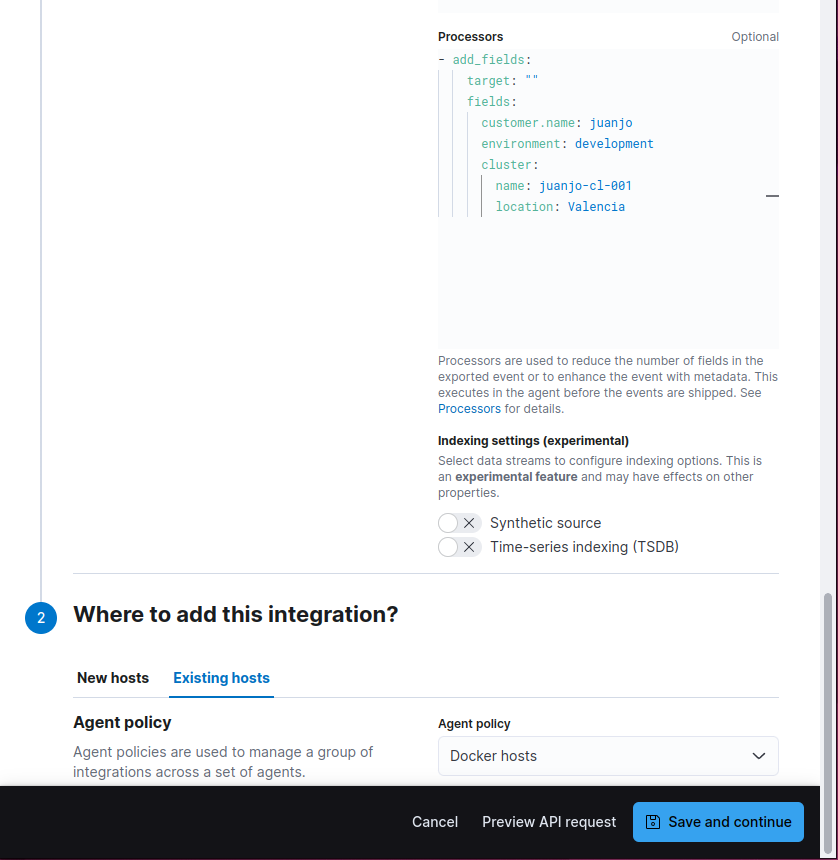
As I wanted to add addional fields to the logs and metrics, I add used the processors field inside the Advanced options section on each input to add an add_fields processor, there are quite a few, fortunately the middle button made pasting fast.

The field definition I used was:
- add_fields:
    target: ""
    fields:
      customer.name: juanjo
      environment: development
      cluster:
        name: juanjo-cl-001
        location: Valencia
Note than, in order to have the fields at the top most level, the target must be set to the empty string, if not, the new fields would be children of the field specified as target.
The next step was to add the docker integration.
From the Integrations tab on the policy description, I used the Add integration buton, and chose Docker from the available integrations:
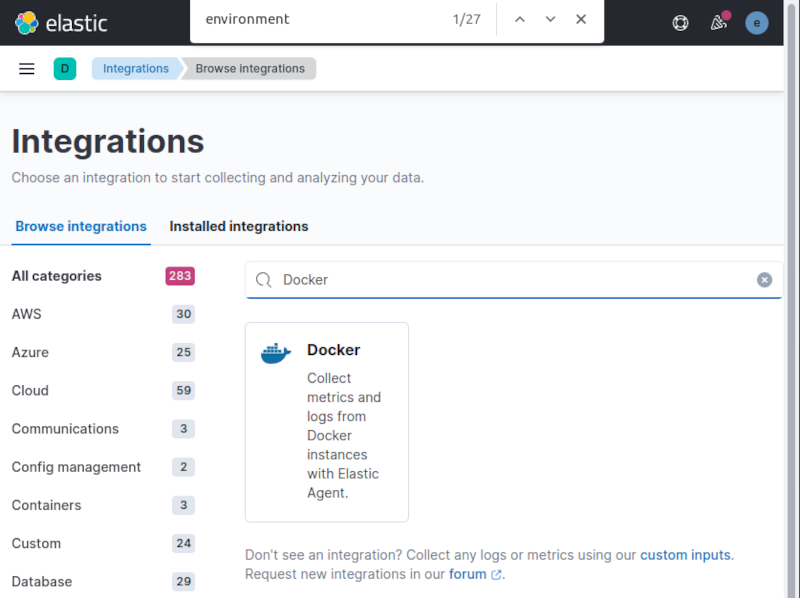
Selecting it displayed the integration description, and clicking on the Add Docker blue button directed me to the settings form, where I pasted the add_fields processor snippet once again in the Collect Docker container logs section at the bottom of the form, to have them enriched with my data.
I also selected my Docker hosts policy as destination of the docker integration.
After clicking on Save and continue, the integration is added to the Docker host policy.
Creating an API key for the agent.
For this section, I followed the Grant standalone Elastic Agents access to Elasticsearch guide, which states:
- In Kibana, navigate to Stack Management > API keys and click Create API key
- Enter a name for your API key and select Restrict privileges. In the role descriptors box, copy and paste the following JSON. This example creates an API key with privileges for ingesting logs, metrics, traces, and synthetics.
{
  "standalone_agent": {
    "cluster": [
      "monitor"
    ],
    "indices": [
      {
        "names": [
          "logs-*-*", "metrics-*-*", "traces-*-*", "synthetics-*-*"
        ],
        "privileges": [
          "auto_configure", "create_doc"
        ]
      }
    ]
  }
}
I didn’t use an expiration time, so I clicked on the create API key. I was redirected back to the API Keys list, but a green dialog was displayed showing the newly created key. I selected Beats on the key format dropdown, as that was the one I was going to use, but storing the complete json format somewhere safe could be also handly, as you can obtain all formats from there. The Beats format is a combination of the key id, and the api_key separated by a semicolon, and the logstash format is the base64 encoded property from the json.
Install the agent
Back on the Fleet section, clicking on the blue Add Agent button, displayed a wizard style dialog were I chose the Run standalone tab, and Docker hosts as policy, then the contents for an elastic-agent.yml settings file were displayed.
Also the sequence of commands to install the agent was displayed. But there was no indication of what to do with the settings file.
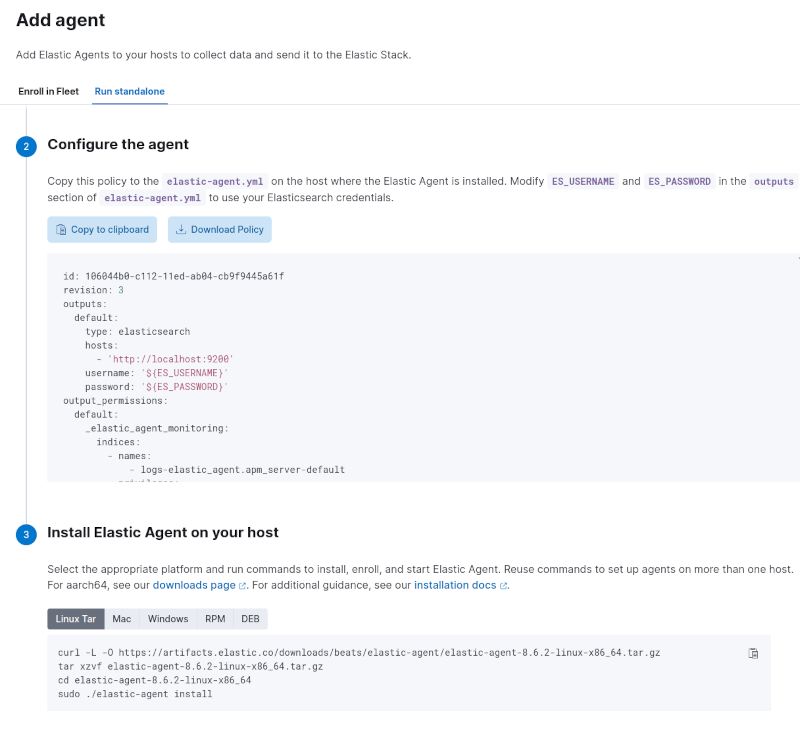
What I did was:
First, download and extract the agent on the host I wanted to monitor, not necessarily the same as elastic is running, using the proposed commands.
curl -L -O https://artifacts.elastic.co/downloads/beats/elastic-agent/elastic-agent-8.6.2-linux-x86_64.tar.gz
tar xzvf elastic-agent-8.6.2-linux-x86_64.tar.gz
cd elastic-agent-8.6.2-linux-x86_64
Then replaced the elastic-agent.yml contents with the proposed ones, updating it to use my elasticsearch server address, the elasticsearch self-signed certificate as CA authority and the api key. The outputs section was then like:
outputs:
  default:
    type: elasticsearch
    hosts:
      - 'https://docker-host-ip-address:9200'
    api_key: 'xxxxxxxxxx:yyyyyyyyyyyyyy'
    ssl.certificate_authorities:
     - |
       -----BEGIN CERTIFICATE-----
       MIIDQTCCAimgAwIBAgIVAP4ZEpWg984wO4afSjeHp680BmTCMA0GCSqGSIb3DQEB
       CwUAMDQxMjAwBgNVBAMTKUVsYXN0aWMgQ2VydGlmaWNhdGUgVG9vbCBBdXRvZ2Vu
       ZXJhdGVkIENBMB4XDTIzMDMxMjEyMDI1NVoXDTI2MDMxMTEyMDI1NVowDzENMAsG
       A1UEAxMEZXMwMTCCASIwDQYJKoZIhvcNAQEBBQADggEPADCCAQoCggEBAImhugS7
       yi9iuMSmQEstBa8rsdn+was0Hjifr+jXLyVnGyHu9kpJSL+MUKn65xxY9Ad4U0Un
       y3sz8Xf6QJALWbHq+nzaRXOZlirpYfVKMjxWlg2FuQs6aLrhvvg8qgfbe/IJSlXI
       S1ATiiLx/VNGY+V060yMwF2LF4l38Gg3XWX4UiKA35Zh2UG1OS8+b9iktIaQwf/D
       Znrae0sIdfJ8svkCAwEAAaNvMG0wHQYDVR0OBBYEFFisNhGFeut7uua8hFg0n8xF
       Io3dMB8GA1UdIwQYMBaAFKtXAikslLyGHIP/4o5yC3eeig/VMCAGA1UdEQQZMBeC
       CWxvY2FsaG9zdIcEfwAAAYIEZXMwMTAJBgNVHRMEAjAAMA0GCSqGSIb3DQEBCwUA
       A4IBAQAGBZ0PMzCUAWQ2bnhEsnt1P5mpC7hCqDnNSgcLzELXFV/p2c4q1P6s3o+/
       JVyJA+uP4dPlccg3Z8B3iBOFIVwC8HLVbrd6Df2lwatS34HXIVnsoo2MZtlrc2wn
       rh3VlZJzS+iRLpzHu/Cw/QXQJTmdsf8jlwJwAWVr/y13L+SNSvEiTLoy1ZT3R0pJ
       wSDS0/GQpy1oFLOEhr9lFwAjahfCV1tLhpaAlQ7opN9v/kUY99ABY324TWT1aq0u
       9kClZn5qVKlBjNeNIgH2o/HUAJW/eXbg/Wcf2yLRDmy7J6xQNJ+DlOMI3boou9yL
       R7OycjB5cqiv43pkfqjBxhh0xu7R
       -----END CERTIFICATE-----
In order to get the certificate, I used the openssl command:
openssl s_client -connect docker-host-ip-address:9200 -showcerts
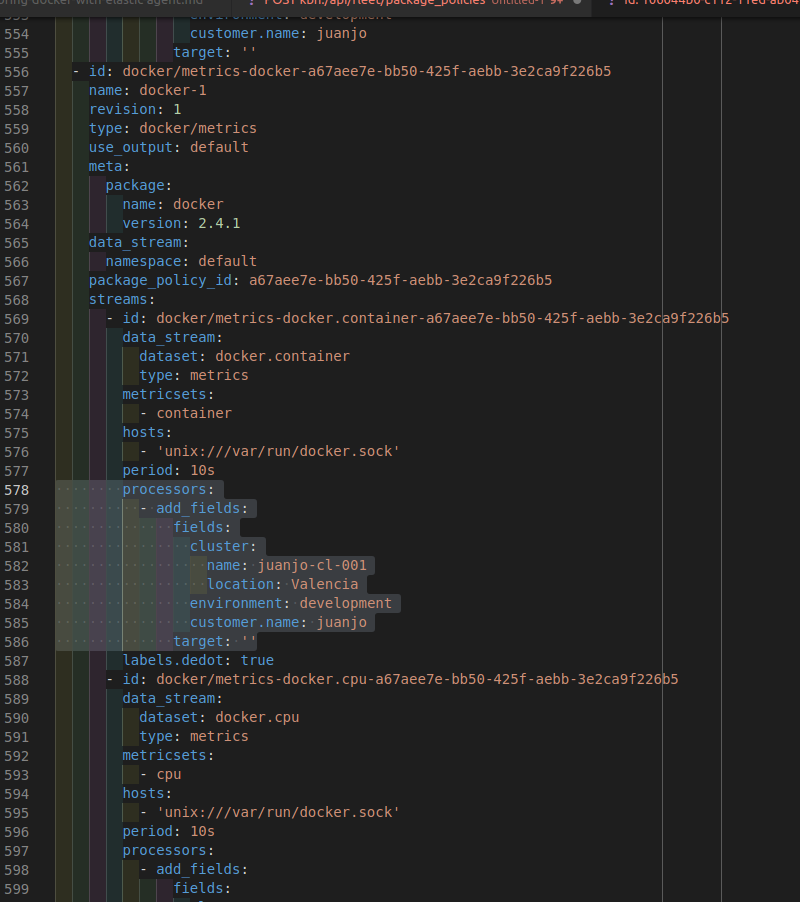
At this point, the agent is unable to add our custom fields to the docker metrics, as the docker integration API doesn’t support the processors field, fortunately the agent does, and we can add them to all docker metrics while editing the settings file. In my case, I added them just below the period field, as in the other streams.
I used echo > elastic-agent.yml to clear the contents of the file before adding the new settings, and the issued the proposed command plus a -n flag to run it in a non interactive way.
./elastic-agent install -n
After a few seconds I got the confirmation than everything went well:
Installing in non-interactive mode.Elastic Agent has been successfully installed.
Checking the data
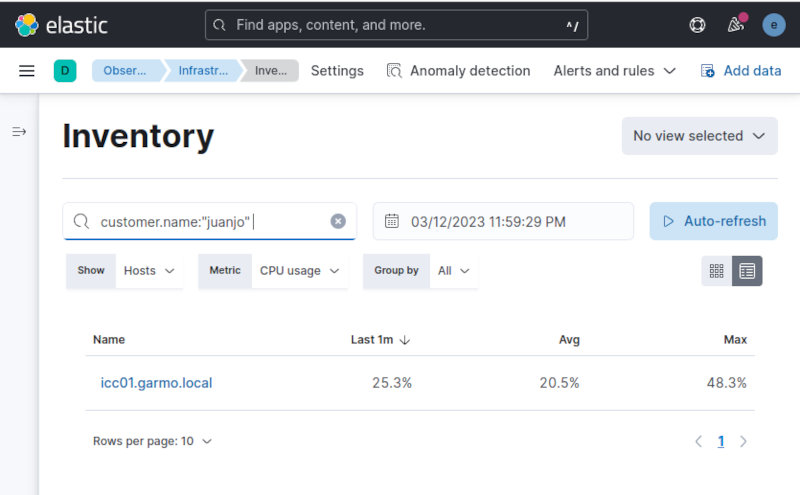
After a few seconds, the host was available on the Inventory section on Kibana, I was even able to use custom fields to filter results.
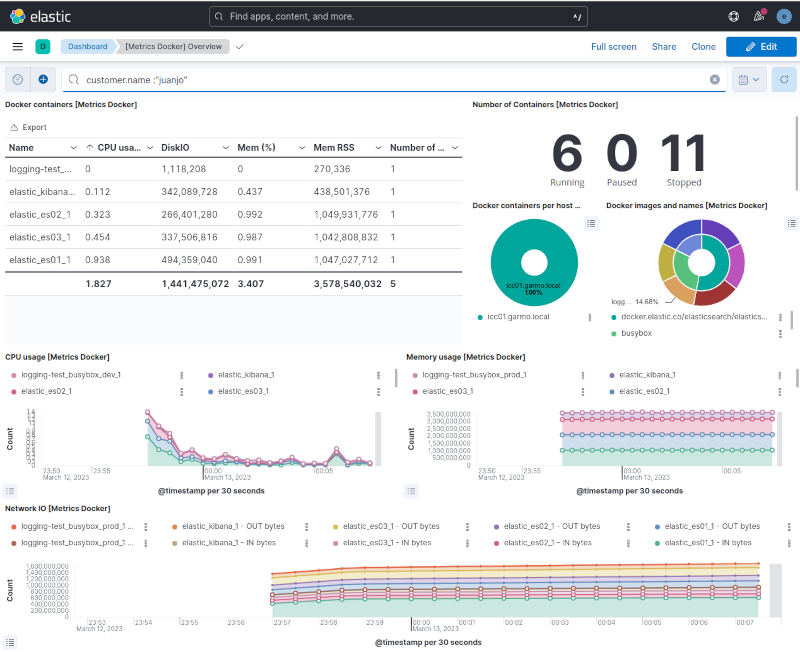
Also the [Metrics Docker] dashboard provided by the docker integration, was also completely functional.
Troubleshooting
There was a bug somewere, and sometimes the image name was not correctly processed because of a wrong mapping, I got a lot of errors on the elastic-agent log (/opt/Elastic/Agent/elastic-agent.XXXX.ndjson) containing this text:
{\"type\":\"mapper_parsing_exception\",\"reason\":\"object mapping for [container.image] tried to parse field [image] as object, but found a concrete value\"}, dropping event!"
To solve this a new processor was needed for the Docker container log collector, so I added a rename processor, for the docker-container-logs-${docker.container.name}-${docker.container.id} section on /opt/Elastic/Agent/elastic-agent.yml file, which was the one used by the agent after installation.
  - rename:
      fields:
        - from: container.image
          to: container.image.name
      ignore_missing: true
      fail_on_error: false
And then, I restarted the agent:
systemctl restart elastic-agent
I found this workaround on the Elastic Forums
Conclusions
For me, this setup was a bit complicated, because adding the fields was not straightforward, even is completely standard, but not for newbies.
Using fleet would be the ideal path to go, but it’s not always an option when you cannot use the same policy for all of them, for instance, to set custom fields. Even at this point, there a still some configurations that can be done with metricbeat or filebeat than fleet can’t do, but manually editing the configuration file for the agent is allowed, like adding processors for docker metrics.
I enjoyed doing this exercise because it was challenging and gave me a lot of knowledge about elastic agent that I’m sure I can take advantage of.
Even motivated me to write a post for this blog I had abandoned for several months.
References
- https://www.elastic.co/guide/en/elasticsearch/reference/current/docker.html
- https://www.elastic.co/guide/en/fleet/8.6/create-standalone-agent-policy.html
- https://discuss.elastic.co/t/docker-logs-keep-getting-dropped-with-tried-to-parse-field-image-as-object-but-found-a-concrete-value-error/326245/33
- https://discuss.elastic.co/t/fleet-custom-logs-integration-add-fields-processor/315070