Monitoring Docker containers with cAdvisor, prometheus and grafana
Yes, you are right, this is jamdcwcpg (just another monitoring docker containers with cAdvisor, prometheus and grafana) blog entry, and yes, Internet is full of them and I read almost everyone available in English, maybe I should write it also in Spanish because there are fewer than in English.
But, as on every other entry on this blog, I don’t meant to write an extensive and exhaustive guide, I’m just telling my experience.
Objective
My objective was being able to add some monitoring to my elasticsearch on docker home lab, so I started digging about how to do it. As stated before, there are plenty of guides, I started with Prakash Iyyanarappan ’s Monitoring Servers and Docker Containers using Prometheus with Grafana guide at medium.com, but I found some problems on the skedler part, so I switched to Mertcan Simsek ’s Docker Monitoring with cAdvisor, Prometheus and Grafana also at medium.com in order to finish grafana configuration.
I have never used neither cAdvisor or prometheus before, so this can also be tagged as another #learnbydoing experience.
Setting up cAdvisor
Maybe this is the trickiest part, as most of the official cAdvisor documentation is based on Debian/Ubuntu linux ecosystem and only a few and unaccurate notes are about running it on RedHat/CentOS. And my home lab is running CentOS 7.
The main problem I found is regarding cgroups location and that it should be run as privileged, but I’m not very comfortable with that, but the composer service to use is:
  cadvisor:
    image: google/cadvisor:latest
    container_name: cadvisor
    privileged: true
    volumes:
      - /:/rootfs:ro
      - /var/run:/var/run:rw
      - /sys/fs/cgroup/:/sys/fs/cgroup/
      - /var/lib/docker/:/var/lib/docker:ro
    ports:
      - 8080:8080
If you don’t plan to access cAdvisor, you can safely remove the port forwarding here, I encourage removing it on production environments, but if you are going to use it, remember to add the port to firewalld.
firewall-cmd --add-port 8080/tcp
firewall-cmd --add-port 8080/tcp --permanent
Setting up prometheus
Setting up prometheus is very straightforward, the only thing you need is a prometheus.yml with the appropiate scrapper for cAdvisor.
First of all, I created the folder hierarchy:
mkdir -p ./prometheus/etc/prometheus ./prometheus/var/lib/prometheus
And then put the following content on the ./prometheus/etc/prometheus/prometheus.yml file:
global:
  scrape_interval: 5s
  external_labels:
      monitor: 'juanjovlc-monitor'
scrape_configs:
  - job_name: 'prometheus'
    static_configs:
      - targets: ['prometheus:9090']
  - job_name: 'cAdvisor'
    static_configs:
      - targets: ['cadvisor:8080']
I used the service name as hostname here as docker is able to resolve it.
And the corresponding compose section:
  prometheus:
    image: prom/prometheus:latest
    container_name: prometheus
    volumes:
      - ./prometheus/etc/prometheus/prometheus.yml:/etc/prometheus/prometheus.yml
    command:
      - '--config.file=/etc/prometheus/prometheus.yml'
    ports:
      - '9090:9090'
The same note regarding ports can be applied here, but with the 9090 port.
firewall-cmd --add-port 8080/tcp
firewall-cmd --add-port 8080/tcp --permanent
Setting up grafana
Setting up grafana is also straightforward, the two things I did were creating the folder and setting up the admin password.
install -d -o 1000 ./grafana/var/lib/grafana
Note the lib folder for grafana should be owned by uid 1000, hence the use of install.
  grafana:
    image: grafana/grafana
    user: "1000"
    environment:
      - "GF_SECURITY_ADMIN_PASSWORD=4-V3RY-STR0NG-P4SSW0RD-H3R3"
    volumes:
      - ./grafana/var/lib/grafana:/var/lib/grafana
    depends_on:
      - prometheus
    ports:
      - '3000:3000'
I wanted to access grafana, and continue accessing it on the future so, I opened the corresponding port:
firewall-cmd --add-port 3000/tcp
firewall-cmd --add-port 3000/tcp --permanent
You can use the admin account to add another user and then remove the environment variable from your compose file.
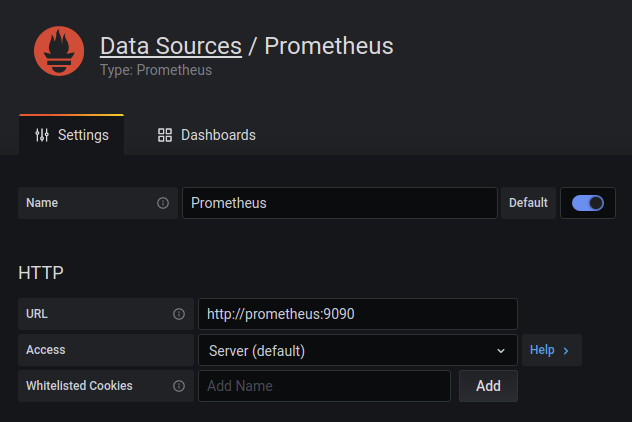
Once it was running, the first step was to create the datasource. Prometheus is the default datasource type, and, in this case, the easiest to set up, writting down the name of prometheus container and the port is enough.
Once the datasource is in place, it’s time to take advantage of other’s works, and, as Mertcan recommended on his guide, I went for the Docker Monitoring by philicious (id 193) on grafanas’ site.
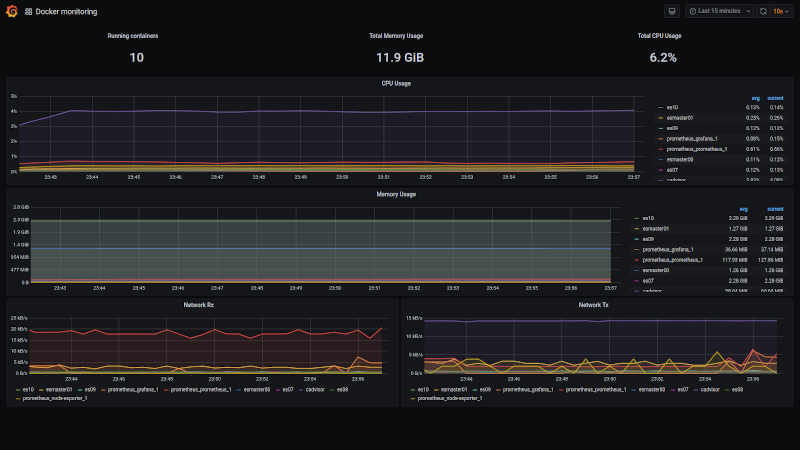
The time I needed to setup grafana was enough for several runs of the scraper, so some data was already available and colorful lines told me everything was working.
Conclusion
It was a good experience learning how to add some observability to running containers. Obviously this is, as the other entries on this blog, something production ready, but it’s a start.
Maybe this can’t change the minds of the people who control the budget at the organization, but, you know, some fancy graphs with a high refresh rate can work their magic.
For me, it was the opportunity to put some concepts I had read about to work.
Next steps
- Traefik as reverse proxy to protect cAdvisor and prometheus.
- Store prometheus data on influxDB.
The complete docker-compose.yml
Here is the complete docker-compose.yml I ended up on this exercise.
version: '3'
services:
  prometheus:
    image: prom/prometheus:latest
    container_name: prometheus
    volumes:
      - ./prometheus/etc/prometheus/prometheus.yml:/etc/prometheus/prometheus.yml
    command:
      - '--config.file=/etc/prometheus/prometheus.yml'
    ports:
      - '9090:9090'
  cadvisor:
    image: google/cadvisor:latest
    container_name: cadvisor
    privileged: true
    volumes:
      - /:/rootfs:ro
      - /var/run:/var/run:rw
      - /sys/fs/cgroup/:/sys/fs/cgroup/
      - /var/lib/docker/:/var/lib/docker:ro
    ports:
      - 8080:8080
  grafana:
    image: grafana/grafana
    user: "1000"
    environment:
      - "GF_SECURITY_ADMIN_PASSWORD=4-V3RY-STR0NG-P4SSW0RD-H3R3"
    volumes:
      - ./grafana/var/lib/grafana:/var/lib/grafana
    depends_on:
      - prometheus
    ports:
      - '3000:3000'