Storing prometheus metrics on influxdb
My last weekend’s self-training exercise was about Monitoring Docker containers with cAdvisor, prometheus and grafana, and prometheus has its own persistence layer based on TSDB files, this model is easy to understand, but also has its drawbacks: taking care of replication, backup and availability has to be handled at file lever.
The objective of this exercise is to add InfluxDB to my monitoring home lab.
The first attempt I made was using the latest version of InfluxDB, 2.0.3 at the moment of writing. So I added it as new service on my docker-compose.yml file:
  influxdb:
    image: quay.io/influxdb/influxdb:v2.0.3
    volumes:
      - ./influxdb/etc/influxdb/influxdb.conf:/etc/influxdb/influxdb.conf:ro,z
      - ./influxdb/var/lib/influxdb:/var/lib/influxdb:z
    ports:
      - 8086:8086
Note that 2.x images are no longer on hub.docker.com influx official images.
Then I made added a remote_write and a remote_read directives to the prometheus.yml file:
remote_write:
  - url: "http://influxdb:8086/api/v1/prom/write?db=prom"

remote_read:
  - url: "http://influxdb:8086/api/v1/prom/read?db=prom"
The docs and the guides say that a database must be created, so I created a bucket on InfluxDB, that is supposed to be the replacement for databases. Unfortunately, it didn’t work.
After a lot of digging, I found an issue on github were several people requested compatibility for prometheus on the 2.x version.
Then I tried using the latest 1.x:
  influxdb:
    image: influxdb:1.8-alpine
    volumes:
      - ./influxdb/etc/influxdb/influxdb.conf:/etc/influxdb/influxdb.conf:ro,z
      - ./influxdb/var/lib/influxdb:/var/lib/influxdb:z
    ports:
      - 8086:8086
Once the container was running, I logged in it and create the database:
host$ docker-compose exec influxdb ash
container$ influx
container$ influx >  CREATE DATABASE prom;
And suddenly, prometheus detected the database and started writing to it. Adding InfluxDB as datasource in grafana was as easy as adding prometheus.
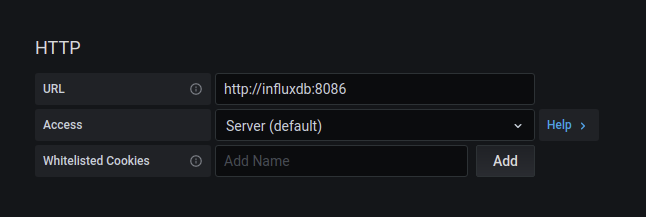
Just go to “Add datasource” then select InfluxDB as provider and enter the address on the box:
I don’t know why, but I expected the grafana’s dashboard which queries prometheus work with a minor adjustment with the new datasource, but I didn’t, because the structure and the query language are not compatible.