My first step on CodeReady Containers
I’ve just got my CodeReady Containers environment up and running so, what’s now? what’s the next thing I should do?
First of all, read some guides, obviously, and the RedHat’s Getting started guide is a good place to start.
Enable monitoring
As I’m not a developer but a System Administrator, the first thing I looked for is to enable the platform monitoring.
Increasing resources.
I was aware of cluster-monitoring-operator was installed along CodeReady Containers, but it is disabled in order to save workstation’s resources, it requires the memory allocation to be raised from 9GB to at least 14GB, so it was the moment to setup the environment.
One can change the configuration using crc command.
[juanjo@Anthrax /home/juanjo]$ crc config set memory 32768
Changes to configuration property 'memory' are only applied when the CRC instance is started.
If you already have a running CRC instance, then for this configuration change to take effect, stop the CRC instance with 'crc stop' and restart it with 'crc start'.
It kindly reminds you that changing the settings of the VM is not allowed while it’s running, so it’s time to restart, but not before enabling some additional cores to be used by CodeReady Containers.
[juanjo@Anthrax /home/juanjo]$ crc config set cpus 8
Changes to configuration property 'memory' are only applied when the CRC instance is started.
If you already have a running CRC instance, then for this configuration change to take effect, stop the CRC instance with 'crc stop' and restart it with 'crc start'.
My goal is to test some Elasticsearch + Graylog configurations once I feel comfortable with the OpenShift environment, so I need plenty of resources. To view the configuration I ran crc config view and the settings were there.

Enabling the cluster-monitoring-operator
As the CodeReady environment now has enough memory, the next step is to enable the cluster-monitoring-operator, we need its numeric ID for that, and to get it first I need to login into OpenShift. First, set up the environment for the oc executable
eval $(crc oc-env)
Then, login into the cluster using the password provided by crc console --credentials
oc login -u kubeadmin -p <password> https://api.crc.testing:6443
Now we can go for the ID running
$ oc get clusterversion version -ojsonpath='{range .spec.overrides[*]}{.name}{"\n"}{end}' | nl -v 0
to get it.
It will display a list of operators, and if I have to bet, I would bet you are going to get 0 as ID for cluster-monitoring-operator, at least if you are using the same release.

Enabling the operator is a matter of a simple command, using 0 as ID in my case:
$ oc patch clusterversion/version --type='json' -p '[{"op":"remove", "path":"/spec/overrides/0"}]'
clusterversion.config.openshift.io/version patched
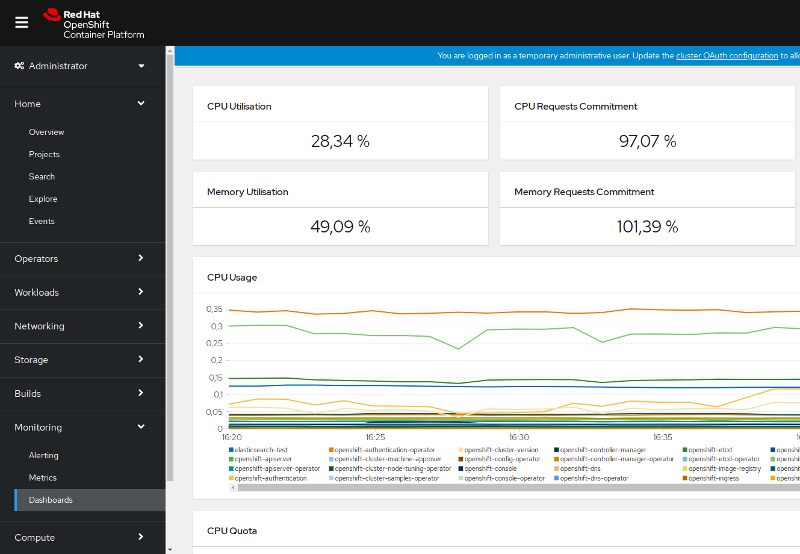
After a few moments, some graphs and several alerts will appear on the OpenShift Dashboard, this is normal, because we are not running a full featured OpenShift environment.
